
Hi Everyone,
Well, "the this market will never go down-you have to buy bulls", that were cheering for 1500 just 11 days ago-who then switched to you have to be defensive-just 3 days ago-are back to new highs are coming again. Fundamental cheerleaders are turning technical for their reason for new highs and all is well again. Maybe they are right and we get the move they are expecting. But there are some serious "differences" I see happening now than with the other drops.
Let's start with the bearish wave counters-who with every drop of more than 30 spx points-have stamped a P2 on their charts and expected the SPX to start the decline to zero. One of the biggest differences I see NOW-they all have wave 4's on their charts with wave 5 to the 1485-1500 on deck. Why is that important? Nobody is looking down-except for the commercial traders-who have one of the largest short position seen in the last 3 years.
Many are saying the drop is finished and now it is back to business for the bulls. The problem I am seeing-that 6 trading day drop did absolutely NOTHING to relieve the extreme bullish sentiment levels I watch. I am talking not even a dent. Everyone expected a PULLBACK and that was it-before we march higher. EVERYONE expected the support levels we hit yesterday to hold-and they did. What everybody is choosing to ignore-is the sell signal that was just generated TODAY on the NYSI. When this signal is triggered with bearish divergences-intermediate tops soon followed. You can see the chart below

Will this divergence trigger be different than the others and we just power higher? It might-but I do find it odd that both bulls and bears are expecting higher as this was triggered. It is NOT a we turn right now signal-but it is something that you better pay very close attention too-especially with the current road map looking lower into November.
Our short term timing systems are looking lower for Wednesday and if we push higher in early trading, I will use that strength to move to a full position on the short side for our port trades. If we head lower, we will manage the open trades and look to scale out at support. G-
Open port positions:
10/16/12 IWM short 1/3 @ 83.21
09/04/12 IWM short 1/3 @ 81.59
Recently closed
09/04/12 IWM short 1/3 @ 82.20 (closed 10/09/12 @ 82.57) -.37
09/06/12 IWM short 1/3 @ 83.11 (closed 09/25/12 @ 83.69) -.58
09/14/12 IWM short 1/3 @ 86.64 (closed 09/17/12 @ 85.80) +.84
09/10/12 IWM short 1/3 @ 84.27 (closed 09/11/12 @ 83.92) +.35
Full closed positions-click here


Well, "the this market will never go down-you have to buy bulls", that were cheering for 1500 just 11 days ago-who then switched to you have to be defensive-just 3 days ago-are back to new highs are coming again. Fundamental cheerleaders are turning technical for their reason for new highs and all is well again. Maybe they are right and we get the move they are expecting. But there are some serious "differences" I see happening now than with the other drops.
Let's start with the bearish wave counters-who with every drop of more than 30 spx points-have stamped a P2 on their charts and expected the SPX to start the decline to zero. One of the biggest differences I see NOW-they all have wave 4's on their charts with wave 5 to the 1485-1500 on deck. Why is that important? Nobody is looking down-except for the commercial traders-who have one of the largest short position seen in the last 3 years.
Many are saying the drop is finished and now it is back to business for the bulls. The problem I am seeing-that 6 trading day drop did absolutely NOTHING to relieve the extreme bullish sentiment levels I watch. I am talking not even a dent. Everyone expected a PULLBACK and that was it-before we march higher. EVERYONE expected the support levels we hit yesterday to hold-and they did. What everybody is choosing to ignore-is the sell signal that was just generated TODAY on the NYSI. When this signal is triggered with bearish divergences-intermediate tops soon followed. You can see the chart below

Will this divergence trigger be different than the others and we just power higher? It might-but I do find it odd that both bulls and bears are expecting higher as this was triggered. It is NOT a we turn right now signal-but it is something that you better pay very close attention too-especially with the current road map looking lower into November.
Our short term timing systems are looking lower for Wednesday and if we push higher in early trading, I will use that strength to move to a full position on the short side for our port trades. If we head lower, we will manage the open trades and look to scale out at support. G-
10/16/12 IWM short 1/3 @ 83.21
09/04/12 IWM short 1/3 @ 81.59
Recently closed
09/04/12 IWM short 1/3 @ 82.20 (closed 10/09/12 @ 82.57) -.37
09/06/12 IWM short 1/3 @ 83.11 (closed 09/25/12 @ 83.69) -.58
09/14/12 IWM short 1/3 @ 86.64 (closed 09/17/12 @ 85.80) +.84
09/10/12 IWM short 1/3 @ 84.27 (closed 09/11/12 @ 83.92) +.35
Full closed positions-click here
Click on charts to enlarge
60 minute timing system: Stochastics are now in overbought zone and trying to roll over. Hard to say if we have a bearish divergence or not-because IWM never went above the previous highs. There is definitely one with the spx. Short term view Bearish
60 Minute timing system (Time Frame-Short term)
Block Volume System: The block volume indicator is back in the extreme overbought zone. It started pulling back some today and it may still have a push up there-but when we see it in this area, a pull back or something bigger is usally not that far away. Short term view Bearish
Block Volume chart (Time Frame-Short term)

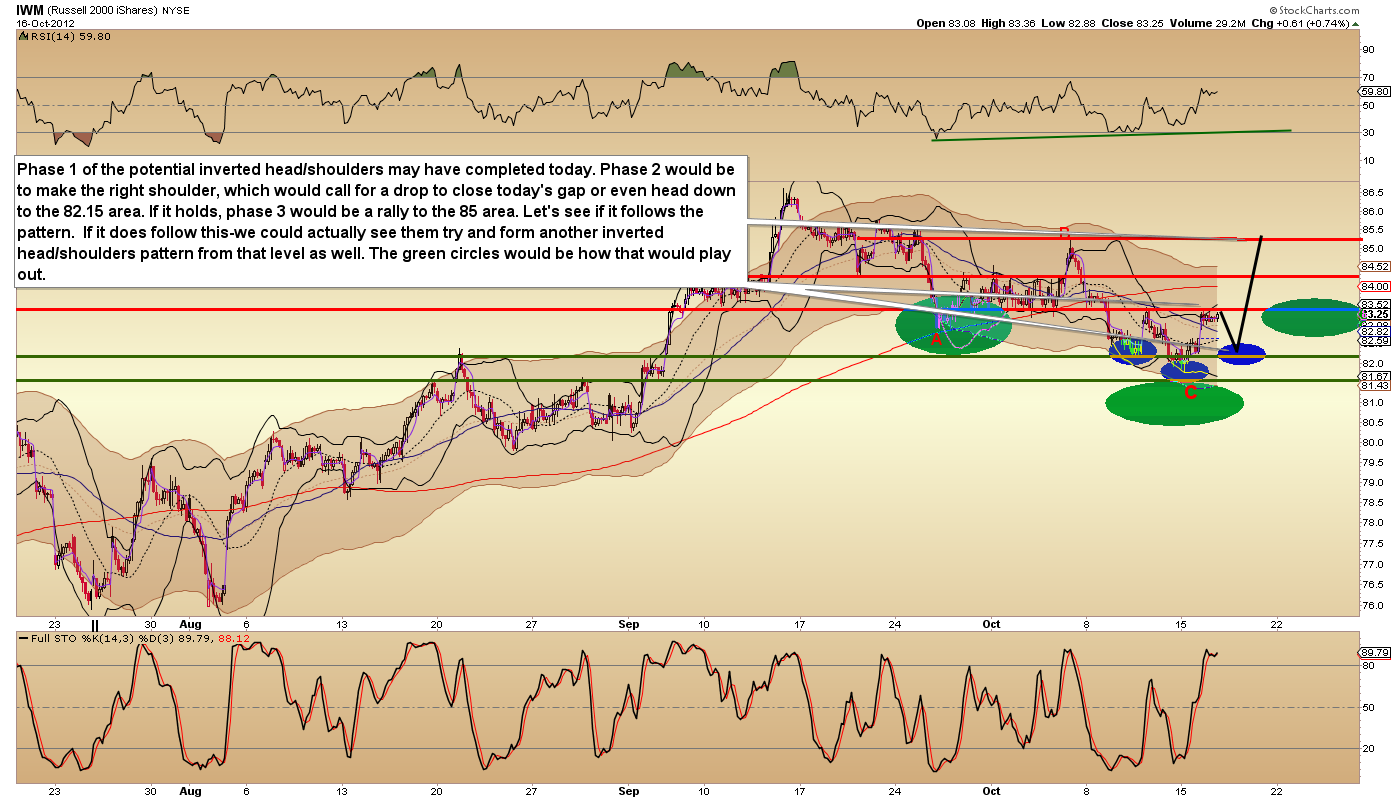
60 minute Chart Phase 1 of the potential inverted head/shoulders may have completed today. Phase 2 would be to make the right shoulder, which would call for a drop to close today's gap or even head down to the 82.15 area. If it holds, phase 3 would be a rally to the 85 area. Let's see if it follows the pattern. If it does follow this-we could actually see them try and form another inverted head/shoulders pattern from that level as well. The green circles would be how that would play out.
IWM 60 minute chart
No comments:
Post a Comment